
Thursday, May 14, 2015
Graphs of Sine and Cosine Functions
To graph Sine and Cosine functions, you need a unit circle. For graphing the important thing to remember is that the x coordinate represents the beta. The sine graph when the points are plotted looks like a letter s rotated to the side while the Cosine graph looks like a big U curve. The normal equation given for graphing Cosine and sine functions is y = Acos/sin(Bx-C) + D. A represents the amplitude which is 1/2 the overall height. The period is 2pi/B and B represents the compression or stretch of the curve depending on if it's between 0 and 1 or greater then 1. C/B represents the phase shift meaning the left or right movement on the graph. D is the vertical shift or the movement up and down on the graph which also could be found through dividing the average of the minimum and maximum points of the curve.
Saturday, May 9, 2015
Cramer's rule
To solve Cramer's problems, you need to use matrices, and with the matrices, you find determinants. You would do all this when you have 2 linear equations. So if you had the equations 2x + 3y= 4 and 3x + y = 5. Then your first matrix would consist of 2, 3 at the top and 3,1 at the bottom. To find the determinent, you cross the top on the left to the bottom of the right and the bottom of the left to the top of the right and multiply. Then you take the product of the top left to bottom right equation and subtract the product of the other equation. You repeat this to find other determinents by making two new matrices and replacing the column for each with 4 and 5 since those are the answers to the equations. In the end you take the determinent of the 2nd and 3rd matrices and divide them by the orignal determinents. 
Tower of Hanoi
The tower of Hanoi is a puzzle but a puzzle that can be solved easily through mathematical induction. The puzzle is that you have 3 slots with a tower of blocks on the first. The tower on the first as a large base and each block above it is -1 the size of the previous block. So if the base block was 4, the next would be 3 then 2 and the top would be 1. To solve it, you must figure out the pattern it takes to transport each to the 3 spot, while only moving one at a time and placing smaller pieces on bigger pieces only. 
Repeating Decimals
Repeating decimals is a way to find out the decimal numbers that infinitely last like .3333... or .1515... To accomplish this, you use the formula, a1/1-d. a1 = the first decimal place it goes up to as a fraction, so for .3333 a1 would be 3/10 because it's .3 which is 30/100 or 3/10. then d = the difference between the first and next digit. Since .3333 repeats after every decimal, d would be 1/10 since it goes downward by 1/10 each digit. The answer would be found after you multiply the reciprical of the bottom to the fraction at the numerator and in this case it would result in 3/9.
Trig Review Week
Trigonometry to me is like a complex, aggravating, annoying, puzzle that takes constant 100% thinking to solve. In order to solve trig problems, you need to know each of the very many trig formulas. With these formulas, you attempt to algebraically solve each problem by using the trig formulas to cancel out or add onto each equation trying to make them equal. An example of a formula is sin^2 + cos^2 = 1. This is utilized frequently in order to make everything in an equation equal to sin or cos. 
2nd Semester Summary
This semester, I think I really I definitely improved as I focused on acheiving the goals I had set at the beginning of the semester. In the beginning I wanted to complete all hw, not fall asleep in class, and avoid careless errors on tests. Well to follow up on my goals, I completed most of my hw leaving behind approximately 2-3 assignments which is still an improvement compared to last semester. I also only fell asleep once in her class the whole semester, like this here is the true accomplishment since I barely get any sleep. And I also brought my average test grade up to around a B+. So overall I would definitely say I had a better semester then first semester.
Here's an artsy pic I took a while ago :D

Friday, May 8, 2015
Polar Coordinates
Polar Coordinates are another way to graph dots like rectangular coordinates. The difference is that rectangular coordinates are plotted with x and y coordinates (x, y) while polar coordinates are done through r and beta (r, beta). Beta is represented with a symbol that looks like a zero with a horizontal line crossing the middle. r represents the circles that protrude outward while beta represents the position of the circle it is located. Each polar coordinate can be graphed in 4 different ways, (+, +), (-, +), (-, -), (+, -). To find r with rectangular coordinates, you use the formula r^2 = x^2 +y^2. This form of graph overall is almost equivalent to rectangular coordinates except the graph used for polar coordinates is circular. 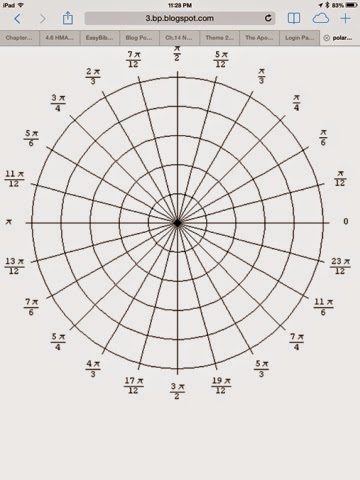
Subscribe to:
Posts (Atom)